Special thanks to Harry Pavlidis (@HarryPav) for supplying me with the HITf/x data (April ’09 public release) earlier tonight. As I’m new to the world of practicing sabermetrics, I appreciated his introductory article.
Growing up when at the plate, I was taught by my Dad and other coaches to “find a way to get it done.” If a bloop single scored the run, then I succeeded. It wasn’t until I became a coach myself that my perspective changed (slightly). I began coaching five years ago and was introduced to the concept “Performance vs. Production.” Defined below:
Performance – the execution of an action. In baseball, a hitter’s performance is the sum of all actions within his control. It’s how he performs.
Production – something produced; output. That is, a hitter’s production is the outcome of his performance. It’s what he produces.
I’ve appreciated the increasing desire for sabermetricians to understand a player’s value without external factors. Tailored statistics such as DIPS, FIP, and tERA have provided us with the ability to analyze pitchers without influence from the other 8 players on the field. Even without context such as the out/base state or Tango’s leverage index, these provide outstanding value.
The “Performance vs. Production” philosophy teaches us to focus on what we can control. A hitter who crushed a ball with a 100+ mph exit velocity at a +10 degree angle (from horizontal) may not get out of the box as the third baseman snares the line drive. In the old days, this scenario would have me believe that I did nothing but fail. However, I now realize how the 100+ mph hitter above actually performed at an extraordinarily high level, yet his production fell to some bad luck. When analyzing how a hitter performs, we must temporarily remove the outcome and focus on what the hitter can control. Fundamentally, three basic factors describe a hitter’s performance: the exit velocity off his bat, the launch angle, and the spray angle.
In developing this philosophy, I’ll make the sweeping assumption that a hitter cannot control his spray angle. (Yes, our eyes and spray charts tell us that certain players like Ortiz & Bonds predominantly pull the baseball.) However at the macro scale, most “good” hitters hit the ball where it’s pitched. That is, a hitter keeps his hands inside the baseball on an inside pitch to barrel it to his pull side while outside pitches are allowed to get deeper and are taken to the oppo field. On the micro level, hitters are taught to keep their bat through the hitting zone longer; once his hands have started and his bat travels through the zone, his bat spray angle continuously changes with no ability to make an adjustment without severely sacrificing bat speed.
Therefore, we’ll focus on the two factors a hitter most certainly can control: ball exit velocity and launch angle. Traditionally these are recognized as “bat speed” and “timing,” respectively. A quick analysis of the available HITf/x data shows a distribution of each of these factors below.

Notice the average at bat produced a ball exit velocity of 82.3 mph at a launch angle 13.3 degrees above horizontal.

Now plotting every batted ball’s launch angle/exit velocity combination, we observe the following scatter plot.
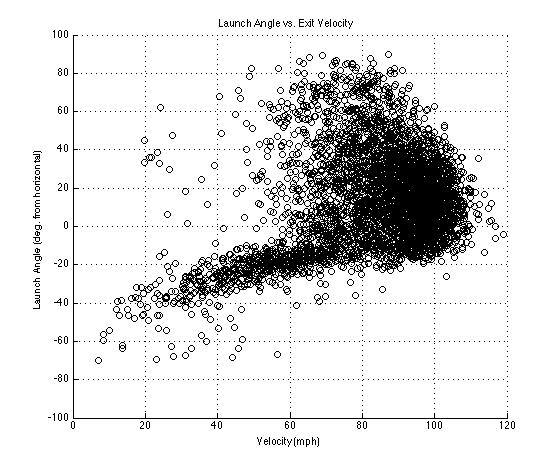
This is where things get interesting (and fun). We can now view the two factors within a hitter’s control in one location. However, we need to find a way to measure it. Long term, increased performance will lead to increased production. So let’s measure the performance. Tango’s wOBA is awesome, however it focuses on a hitter’s production. A hitter can’t control how an opposing player fields his batted ball, so why should we measure his value based off of these factors? A hitter has virtually no control over reaching on errors, and I would argue (at the MLB level) he has very little control over HBPs. [I'm a long time HBP advocate for players as long as they are properly taught how to protect themselves (maybe a future teaching post). Yes, he controls where he stands in the box and how he reacts to an inside pitch, but in general, HBPs are controlled by the pitcher.] Even singles, doubles, and triples possess a large defensive bias.
Therefore, let’s remove luck, chance, and defensive alignment/skill and evaluate a hitter’s performance. To do so, we’ll take a look at what exit velocity and launch angle combinations will lead to expected outcomes. I’ve broken down the two factors into 40 “bins.” Specifically, I broke exit velocity into 4 mph increments and launch angle into 3 degree increments. Therefore, the 40×40 matrix provides 1,600 bins (many are empty, grey). Within each bin, a certain number of batted balls were tracked and marked with a specific outcome (e.g. out, single, HR, etc.) I then averaged the wOBA within each 4 mph x 3 degree bin. The heat map below displays the outcome of that analysis. Red & yellow denote high wOBA (HRs & XBH’s); teal/green depict medium wOBA (think singles); blue represents poor wOBA (outs). Optimal hitting occurs approximately between 18-40 degrees in excess of 95 mph.
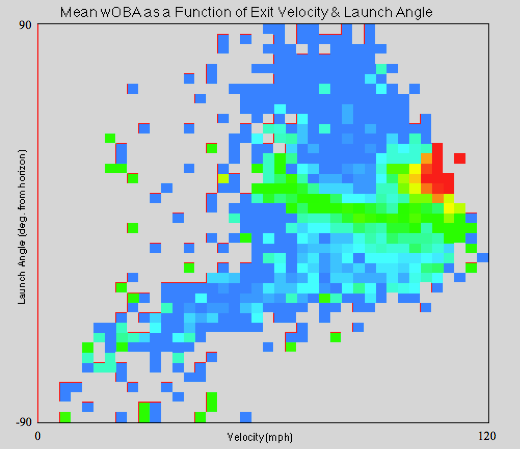
Due to the limited data set (< 5,000 AB’s), the resolution is grainy, at best. I’m imagining Sportvision’s database by now would provide quite an elegant heat map. Given the opportunity to analyze realtime HITf/x data, I would measure a hitter’s performance using Tango’s wOBA as a foundation. However, in lieu of assigning the linear weight associated with the outcome of a hitter’s AB, let’s analyze the exit velocity and launch angle, then use a LUT (look up table, with significantly higher resolution) to find the average linear weight associated with all balls hit within that bin. Accounting for all hits, outs, and ROEs then averaging will enable us to substantially reduce performance increase/suppression due to factors external to the hitter. This allows us to utilize the large data set of the broad population to analyze an individual hitter’s performance. Maybe we call it pOBA (Performance On-Base Average).
We could then make an adjustment for baserunning speed/ability using FIELDf/x. For balls hit to the outfield, we could then easily perform park adjustments, if desired. After all, in the infield, home to 1st is 88′ – 9″ regardless of the stadium in which one plays. Pair our newly created context independent pOBA statistic with my longtime favorite RE24, and you’ve got an incredible analysis for MLB hitters.